
When I was recently creating a new query at a customer, I have found a strange phenomenon. The query should show the average ticket number of a department. First you see the explanation and then I provide the solution of the problem.
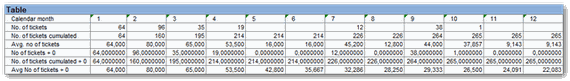
The query should show the individual, cumulative and average monthly values, as you can see in the screenshot.
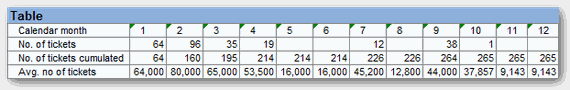
As you can see, there are no values for the months of May, June, August, November and December, so the cumulative values remain the same as the previous month.
Unfortunately the calculation of the average has a problem, when a column has no value (for example May). In comparison the average value with the Excel formula AVERAGE.
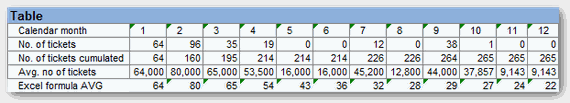
As you can see in the screenshot above, the key figures differ between the Excel formula and the result from the BEx Analyzer. According to the Excel formula the month of May has an average of 43, according to the BEx Analyzer it has an average of 16. This is a large deviation. As you can see this error runs through all months after one column has no value.
The interesting thing about the query is, if you have a department that has values from January to December, the average of the Bex Analyzer works without problems.
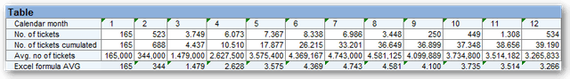
The line Avg. no. tickets is identical to the line Excel formula AVG. That means the query definition is correct and working. But if there are months where no values have been posted, the average calculation of the BEx Analyzer failed.
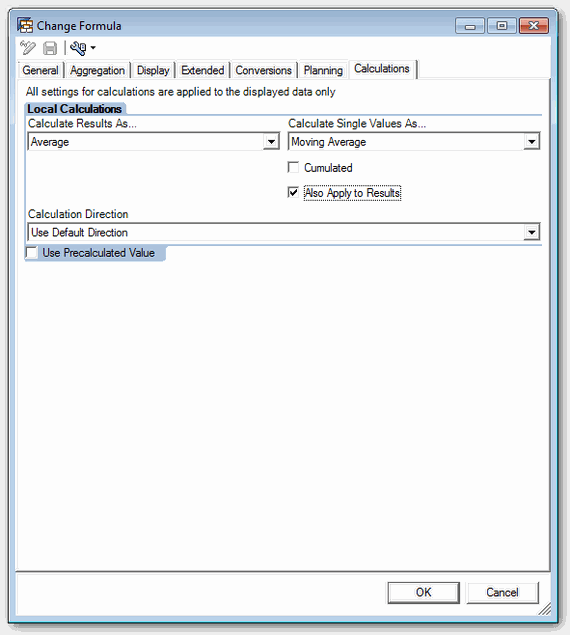
The following settings have been made to the key figures:
No of tickets cumulated: the key figure is only cumulative, otherwise no further calculations.

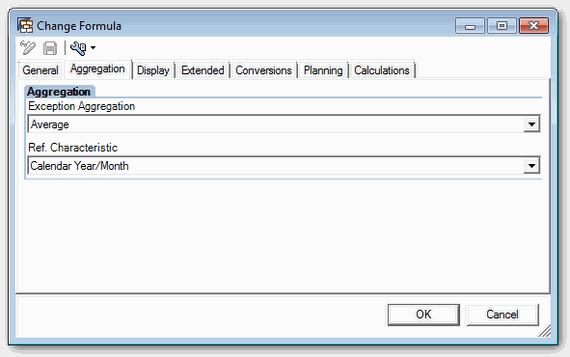
Avg. no tickets: Aggregation on average with reference characteristic to Calendar Year/Month (0CALMONTH) and calculating the individual values and results as average or moving average.
The question arises to me now is, why it works correctly when the entire year have posted values, but not when there are months without value. The cumulative value is also correctly calculated and doesn't show an error. Only the average value is incorrect. Unfortunately, that was a problem for my client, since the report was intended of the controlling department and this department, you surely know, love Excel ;)
So why the BEx Analyzer does interprets a blank line at cumulative values as 0, but failed if you want to calculate an average.
So that the controlling department get the same result in the Bex Analyzer like with the Excel formula, we needed a solution. After a little research I found this SCN article, which says insert a new formula and add to this formula a 0. So nothing complicated, just a simple solution.

As you can see on the screenshot below, the row Avg no of tickets + 0 has now another value than the row avg no of tickets. The cumulative value is identical.
Now the comparison with the Excel formula AVERAGE:
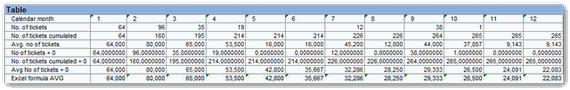
And as you can see now, the row avg. no of tickets + 0 and the row Excel formula AVG are identical. So I only have to hide the unnecessary rows and the query can be used. I hope this may help someone when you walk into the same issue. ;)
These posts might also be interesting:
author.
I am Tobias, I write this blog since 2014, you can find me on twitter and youtube. If you want you can leave me a paypal coffee donation. You can also contact me directly if you want.


Write a comment